Case study: simulating system underperformance


A new white paper, “Beyond the brochure: Exposing the reality of refrigeration product underperformance,” by Eurovent Certification, presents recent research findings based on tests conducted on selected heat rejection equipment, including products not certified under a third-party scheme at the time of testing. The study indicates that in certain climates, the performance declared by manufacturers and the performance measured in the laboratory could vary significantly. Indeed, tests on uncertified CO2 gas coolers found that measured heat rejection capacity could be up to 53% lower than declared in Central and Northern European regions and up to 37% lower than declared in warm weather climates.
Taking data from the gas cooler study and the results from previous research on the performance of HFC air-cooled condensers, Eurovent Certification used simulation software to assess the potential impact of underperforming HFC and CO2 heat rejection components on a whole supermarket system. These are the results of those simulations.
Case study aims
The aim was to:
1) Ascertain the potential impact of underperformance in terms of:
- Additional energy consumption
- Additional running costs
- Additional CO2 emissions.
2) Simulate underperformance at different rates to evaluate impact over 1-year, 10-years and 15-years (whole life cycle).
Method
Using simulation software, the impact of underperforming heat rejection devices was calculated using two typical technical solutions for a supermarket application:
- System 1: CO2 transcritical installation
- System 2: Medium temperature (MT) and low temperature (LT) HFC installation.
Both systems were put through a range of simulations to calculate the impact of underperformance based on the following set-up:
System size:
-
Medium temperature (MT): Teva = -8 °C; Qeva = 180 kW
- 112 kW from cabinets – 62%
- 68 kW from coldrooms – 38%
- Low temperature (LT): Teva = -30 °C; Qeva = 50 kW
- 23 kW from cabinets – 46%
- 27 kW from coldrooms – 54%
Baseline: +2K approach point temperature difference (condenser / gas cooler outlet – ambient)
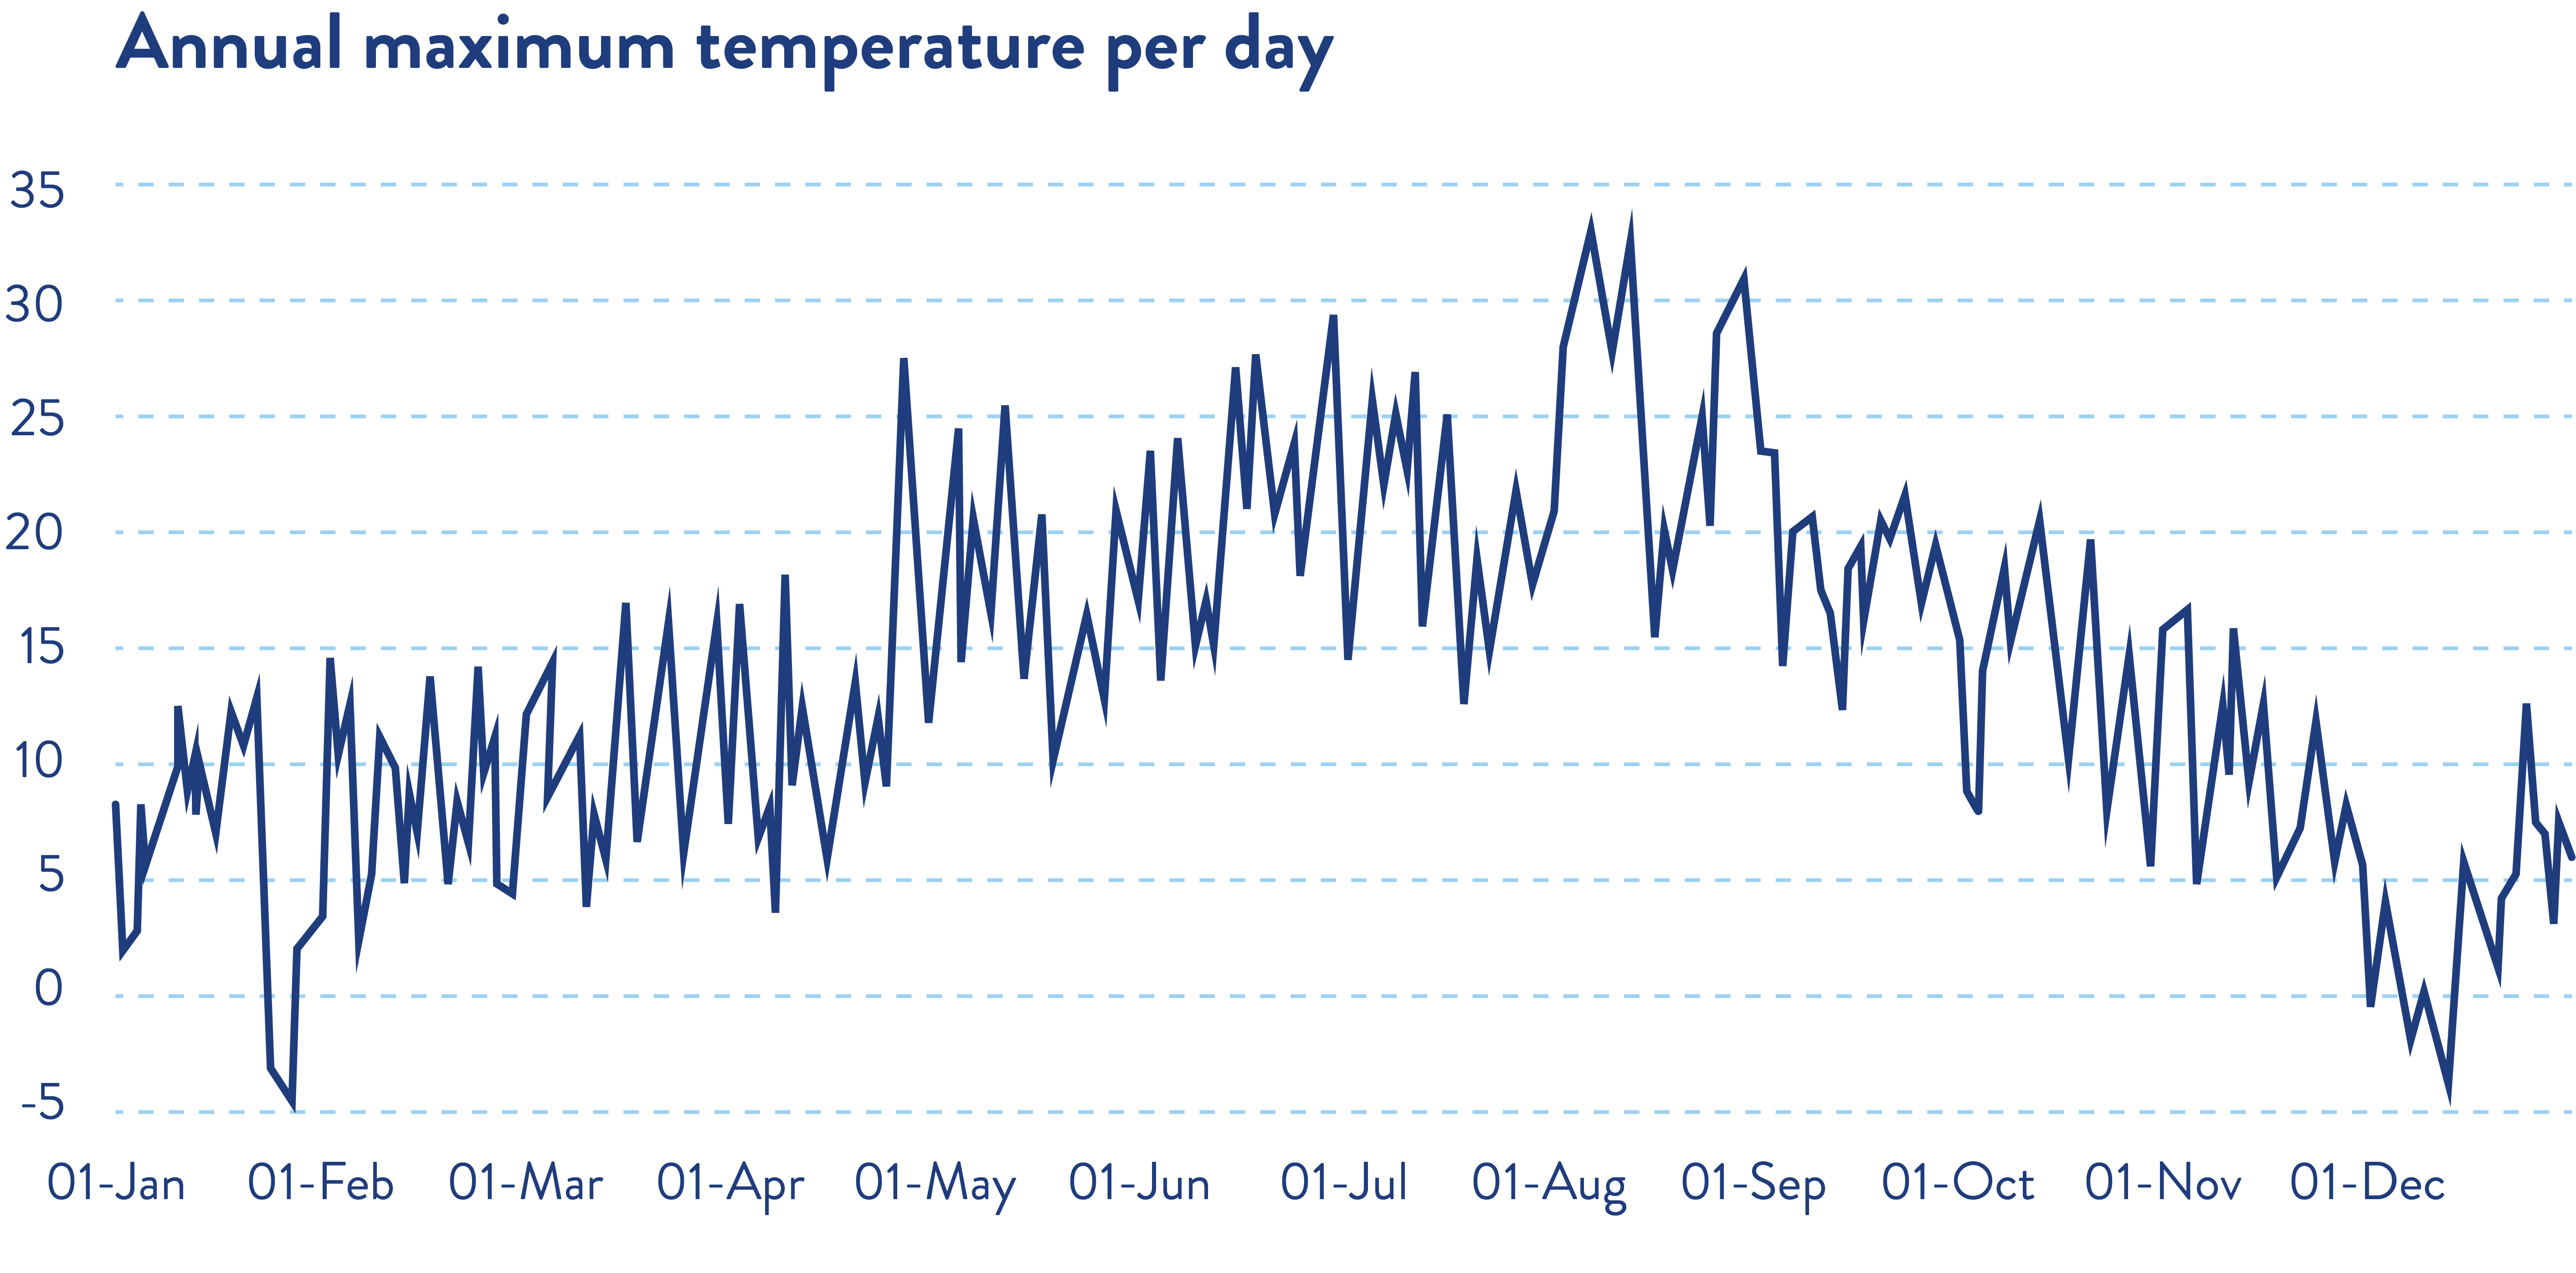
Climate profile [1]: Münich (DE)
Pack typology: CO2 booster and R448a
Emission factor [2]: 338 gCO2/kWh – average from 2020-2023
Electricity cost: 0,18 €/kWh
Figure 1: Annual maximum temperature per day
Case study system 1: CO2 transcritical installation
In this system, heat rejection is performed by a CO2 gas cooler. In the white paper research, CO2 gas coolers were tested across five market conditions, with the highest deviation displayed at conditions 3 and 4.
Table 1: Deviations between declared and measured heat rejection capacity
| Operating Conditions | Gas Cooler 1 | Gas Cooler 2 |
|---|---|---|
| Condition 1 (standard condition SC20) | 8% | 8% |
| Condition 2 | -33% | -37% |
| Condition 3 | -39% | -41% |
| Condition 4 | -50% | -53% |
| Condition 5 (standard condition SC25: condenser) | -32% | -23% |
The sign “-“ means underperformance
For this case study, performance is evaluated according to the different conditions listed in table 2, which are based on the average underperformance from the white paper research.
Underperformance is expressed as increased delta T for the simulations. This translates the lost capacity into a reduced temperature change across the gas cooler. This results in a significantly higher outlet temperature, which may lead to increased high-side pressure and compressor energy consumption, and may reduce overall system capacity and efficiency.
Table 2: Underperformance according to each condition based on test results
| Operating Conditions | Av. deviation | Increased delta T |
|---|---|---|
| Condition 3 | -40% | + 2 K (CO2 outlet Temperature 34°C instead of 32°C) |
| Condition 4 | -51,5% | + 2.6 K (CO2 outlet Temperature 34.6°C instead of 32°C) |
| Condition 5: Condenser (CO2 Subcritical operation) | -32% | + 3.5 K (CO2 condensing Temperature 18.5 °C instead of 15°C) |
The gas cooler operates as a condenser for T ambient ≤18°C and in transcritical mode when T ambient >18°C.
Results
System performance was simulated at both condition 3 and condition 4, taking into account the underperformance experienced when operating in subcritical mode (condition 5). The simulations evaluated additional energy consumption, additional running costs and additional CO2 emissions over a 1-year, 10-year and 15-year period.
Table 3: Underperformance of a CO2 installation at alternatively Condition 3 and condition 5
| Condition 3 & 5 | 1 year | 10 years | 15 years |
|---|---|---|---|
| Percentage difference vs. baseline [%] | + 11,5% | + 11,5% | + 11,5% |
| Additional energy [kWh] | 43586 | 435864 | 653795 |
| Additional cost [€] | 7846 | 78455 | 117683 |
| Additional CO2 emission [tons] | 14,7 | 147,3 | 221 |
Table 4: Underperformance of a CO2 installation at alternatively Condition 4 and condition 5
| Condition 4 & 5 | 1 year | 10 years | 15 years |
|---|---|---|---|
| Percentage difference vs. baseline [%] | + 11,6% | + 11,6% | + 11,6% |
| Additional energy [kWh] | 43935 | 439354 | 659031 |
| Additional cost [€] | 7908 | 79084 | 118625 |
| Additional CO2 emission [tons] | 14,9 | 148,5 | 222,8 |
Case study system 2: HFC installation
In this case study, heat rejection is performed by a HFC condenser using R448a refrigerant with a 32% underperformance. The 32% underperformance is based on a previous study on HFC condensers. This results in a +3,5K condenser outlet temperature penalisation under the assumption used for this simulation all year round.
Results
The simulation displayed the additional energy consumption, running costs and CO2 emissions over a 1-year, 10-year and 15-year period as follows.
Table 5: Underperformance of a HFC installation
| 1 year | 10 years | 15 years | |
|---|---|---|---|
| Percentage difference vs. baseline [%] | + 11,7% | + 11,7% | + 11,7% |
| Additional energy [kWh] | 43360 | 433603 | 650404 |
| Additional cost [€] | 7805 | 78048 | 117073 |
| Additional CO₂ emission [tons] | 14,7 | 146,6 | 219,8 |
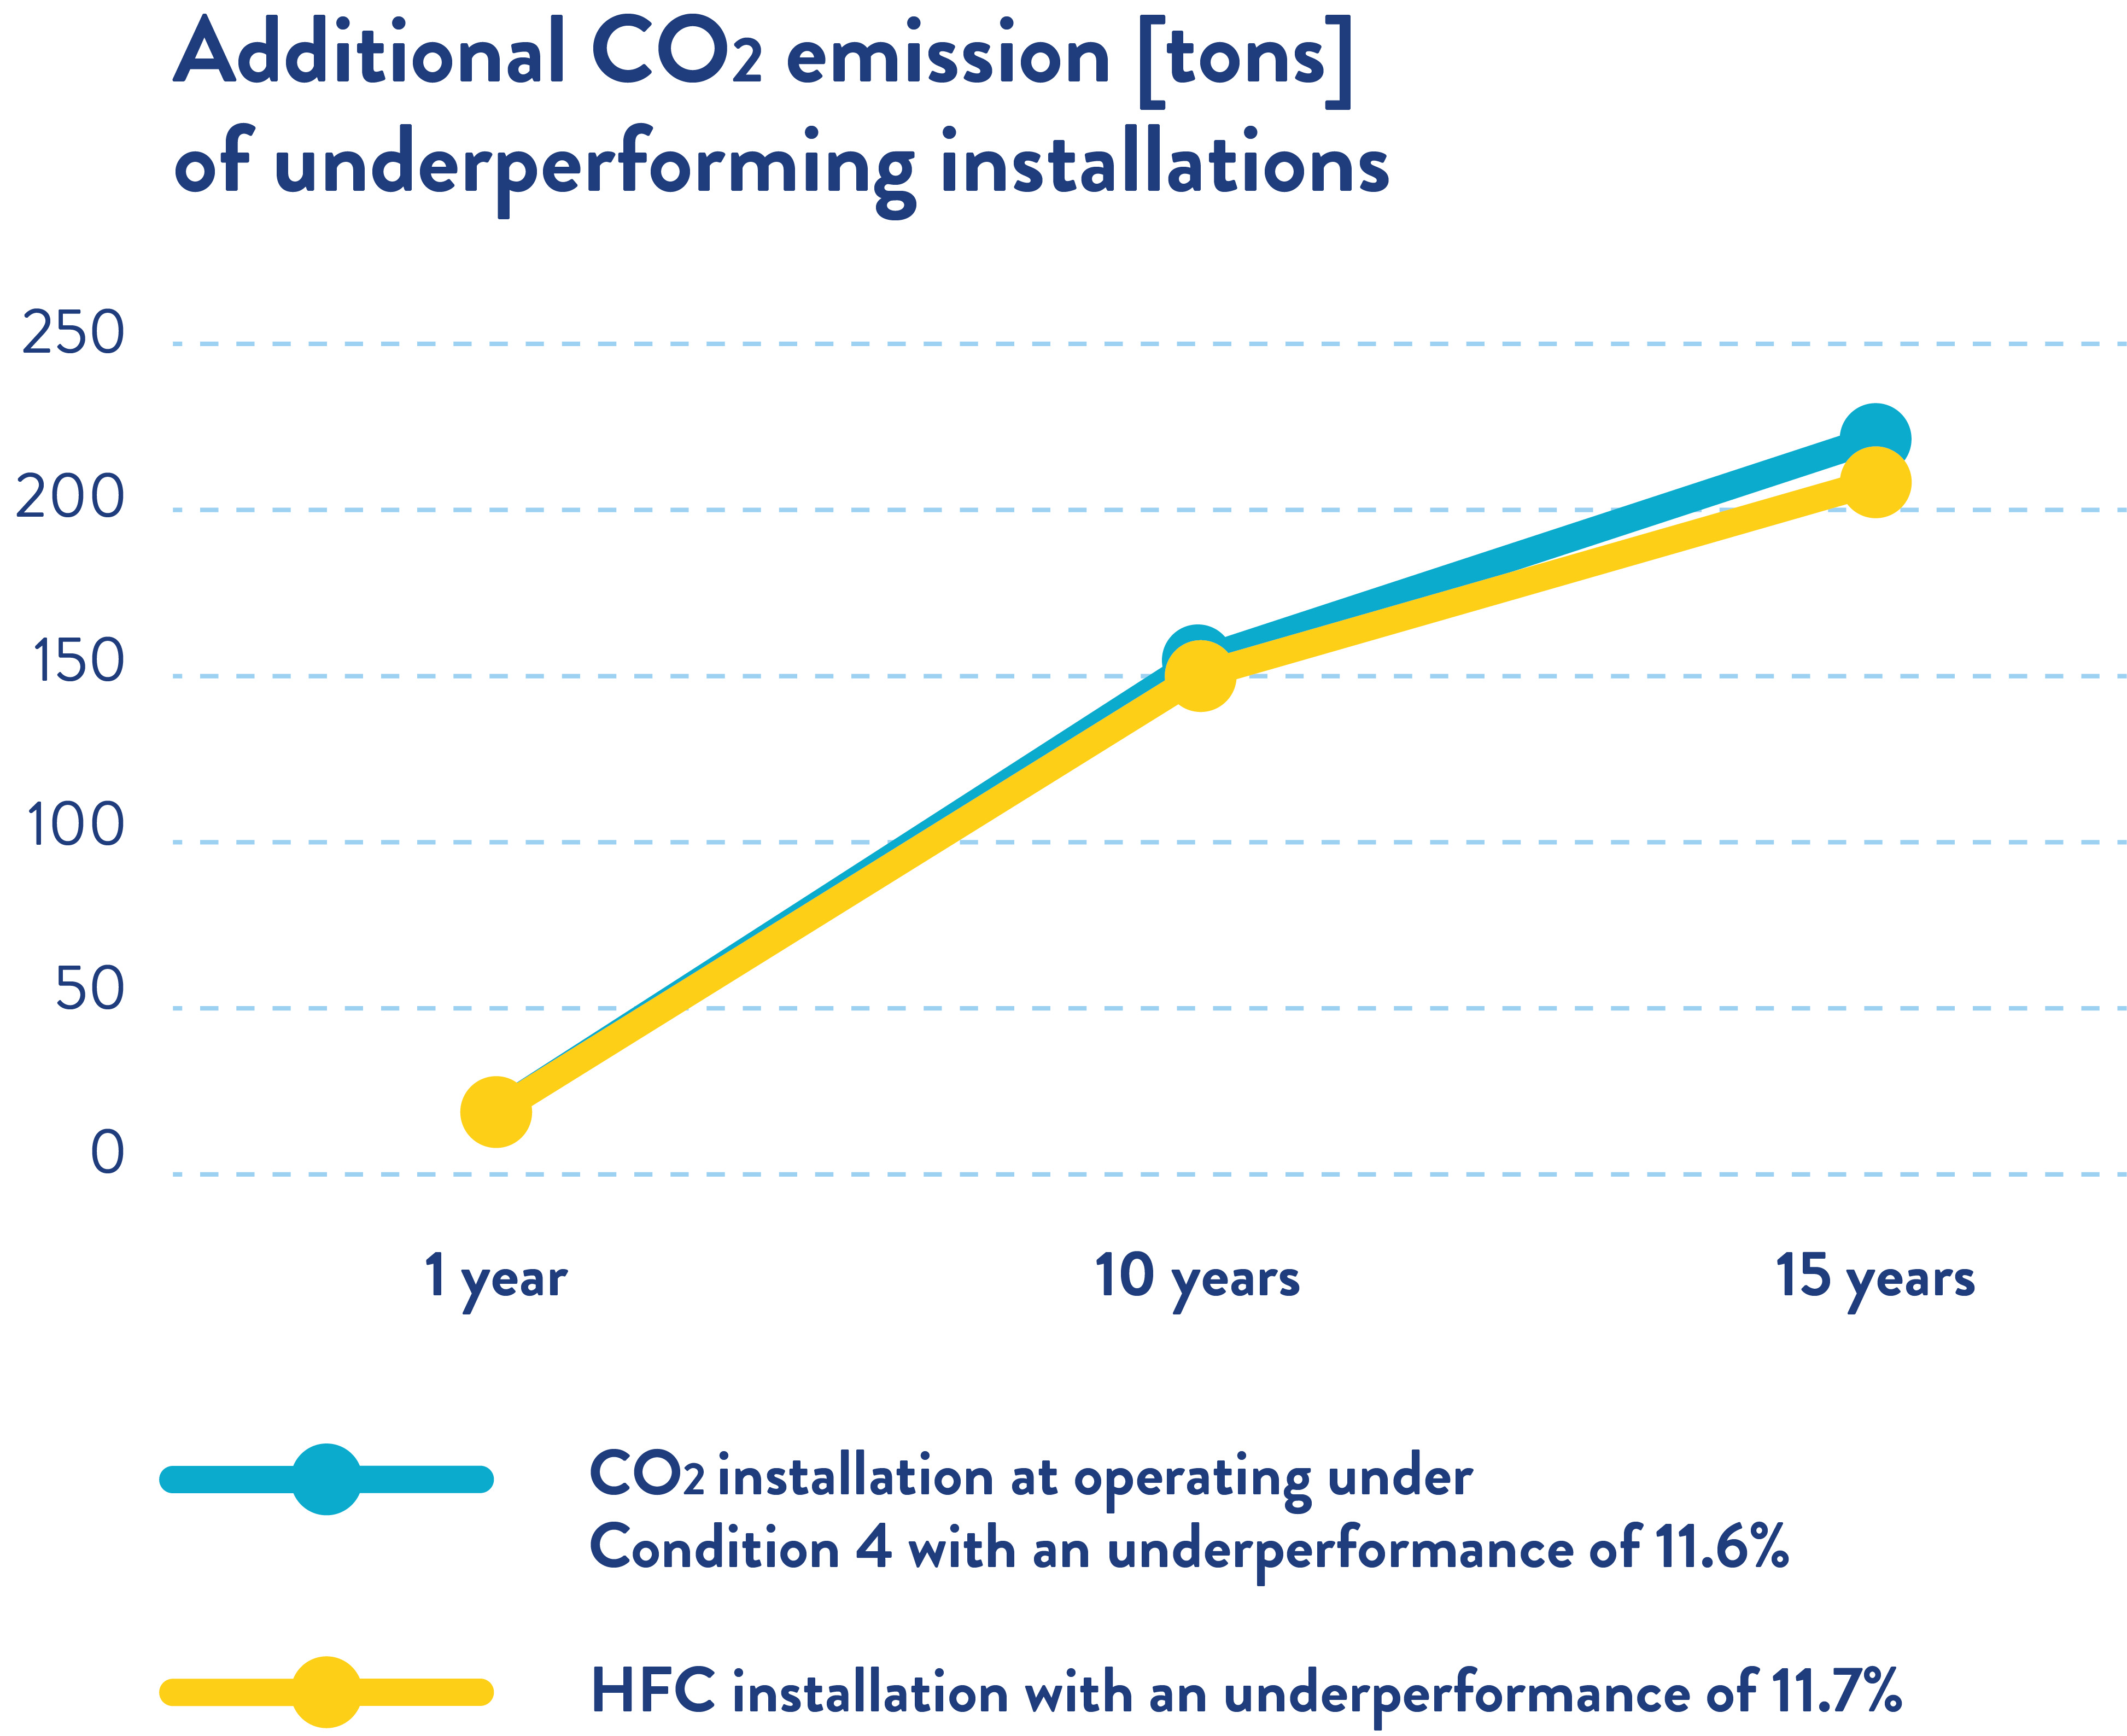
For both the HFC and CO2 systems, inefficient heat rejection components result in over 43,000 kWh extra energy use annually, costing more than €7,800 a year and adding at least 14.7 tonnes of CO2 emissions under the assumptions applied in case studies.
Figure 2: comparison of additional CO2 emissions between underperforming HFC and CO2 installation
Measuring different underperformance rates
The above case studies illustrate condenser and gas cooler underperformance based on a selection of systems showing the largest performance deviations observed in the studies analysed by Eurovent Certification. To provide a broader view of the impact on refrigeration systems across different underperformance rates, the following scenarios were simulated for comparative and illustrative purposes:
S1 case: CO2 refrigerant, -10% penalisation= +0,5K condenser outlet temperature in transcritical phase and +2,5K in sub-critical phase
S2 case: CO2 refrigerant, -20% penalisation= +1K condenser outlet temperature in transcritical phase and +3K in sub-critical phase
S3 case: CO2 refrigerant, -30% penalisation= +1,5K condenser outlet temperature in transcritical phase and +3,5K in sub-critical phase
S4 case: R448a refrigerant, -10% penalisation= +2,5K condenser outlet temperature all year round
S5 case: R448a refrigerant, -20% penalisation= +3K condenser outlet temperature all year round
S6 case: R448a refrigerant, -30% penalisation= +3,5K condenser outlet temperature all year round
Results were simulated across 1-year, 10-years and 15-years to mimic the lifecycle of HFC condensers and CO2 gas coolers.
Figure 3: Percentage difference vs baseline
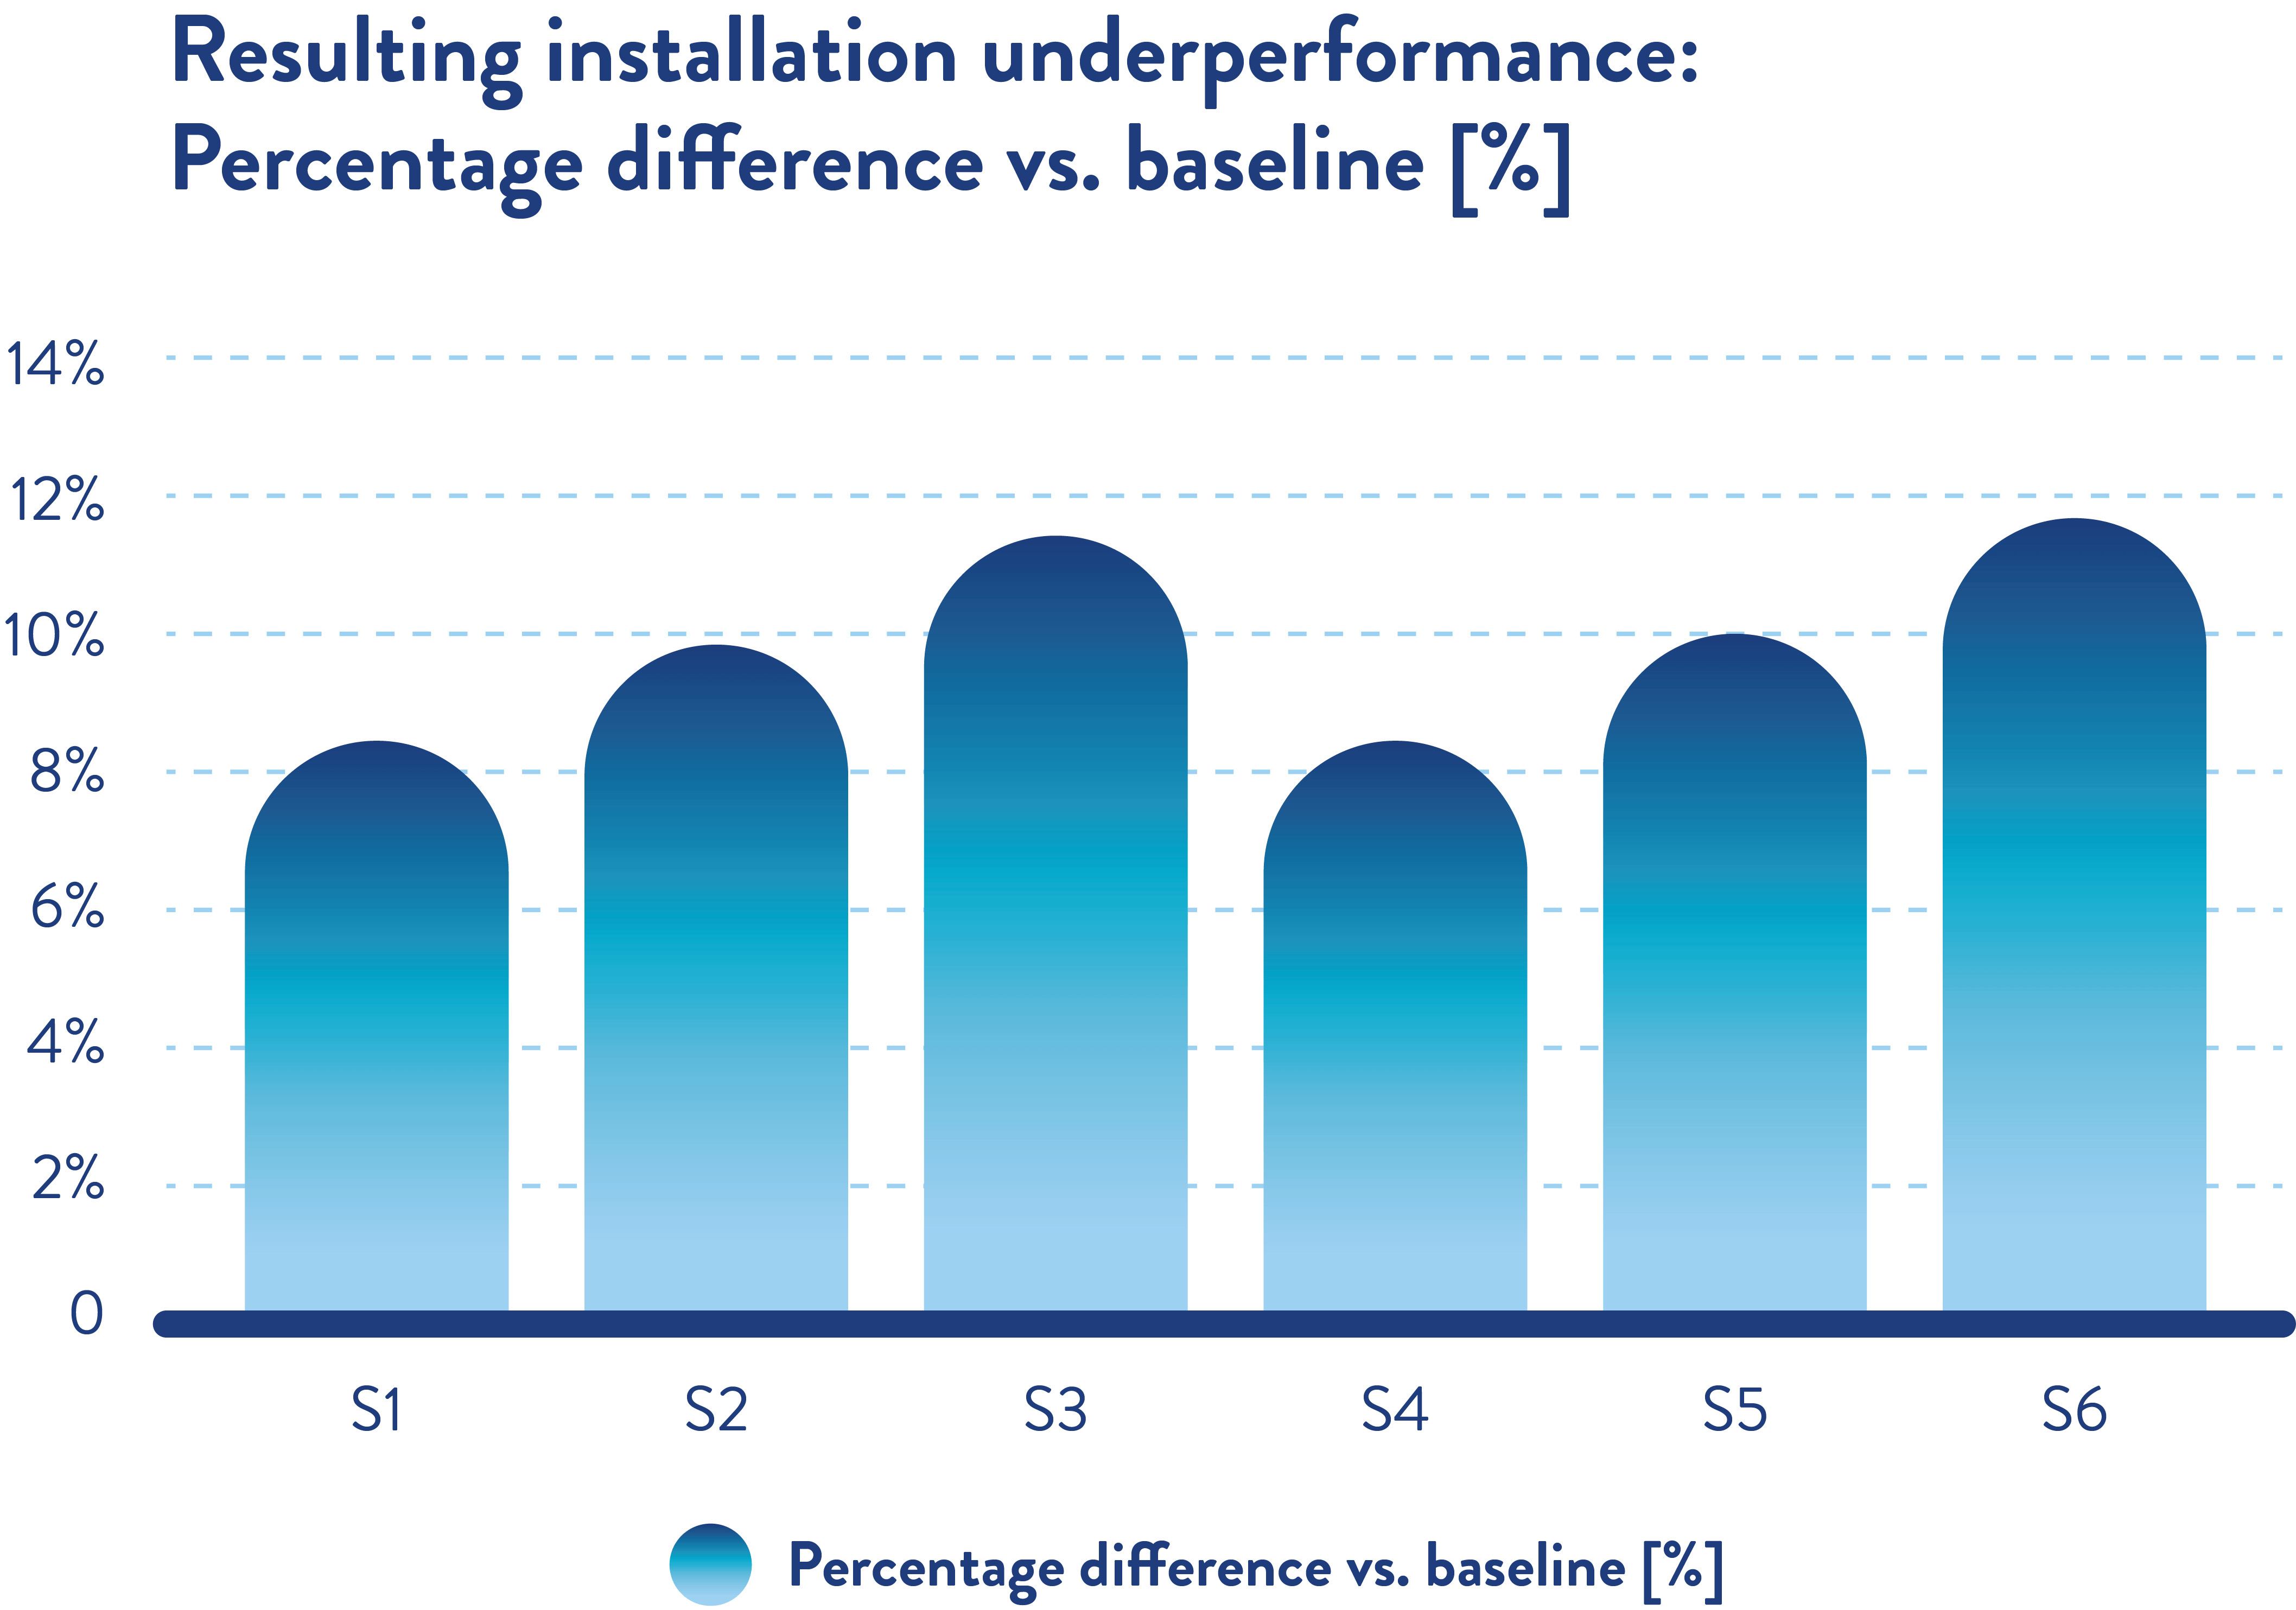
Table 6: Underperformance at varying conditions over a 1-year period.
| 1 year | S1 | S2 | S3 | S4 | S5 | S6 |
|---|---|---|---|---|---|---|
| Percentage difference vs. baseline [%] | + 8,1% | + 9,8% | + 11,4% | + 8,5% | + 10,1% | + 11,7% |
| Additional energy [kWh] | 29776 | 36448 | 43301 | 30214 | 36707 | 43360 |
| Additional cost [€] | 5360 | 6561 | 7794 | 5438 | 6607 | 7805 |
| Additional CO₂ emission [tons] | 10,1 | 12,3 | 14,6 | 10,2 | 12,4 | 14,7 |
Table 7: Underperformance at varying conditions over a 10-year period.
| 10 years | S1 | S2 | S3 | S4 | S5 | S6 |
|---|---|---|---|---|---|---|
| Percentage difference vs. baseline [%] | + 8,1% | + 9,8% | + 11,4% | + 8,5% | + 10,1% | + 11,7% |
| Additional energy [kWh] | 297760 | 364479 | 433009 | 302138 | 367071 | 433603 |
| Additional cost [€] | 53597 | 65606 | 77942 | 54385 | 66073 | 78048 |
| Additional CO₂ emission [tons] | 100,6 | 123,2 | 146,4 | 102,1 | 124,1 | 146,6 |
Table 8: Underperformance at varying conditions over a 15-year period.
| 15 years | S1 | S2 | S3 | S4 | S5 | S6 |
|---|---|---|---|---|---|---|
| Percentage difference vs. baseline [%] | + 8,1% | + 9,8% | + 11,4% | + 8,5% | + 10,1% | + 11,7% |
| Additional energy [kWh] | 446640 | 546719 | 649514 | 453207 | 550607 | 650404 |
| Additional cost [€] | 80395 | 98409 | 116912 | 81577 | 99109 | 117073 |
| Additional CO₂ emission [tons] | 151 | 184,8 | 219,5 | 153,2 | 186,1 | 219,8 |
Figure 4: Additional CO2 emissions
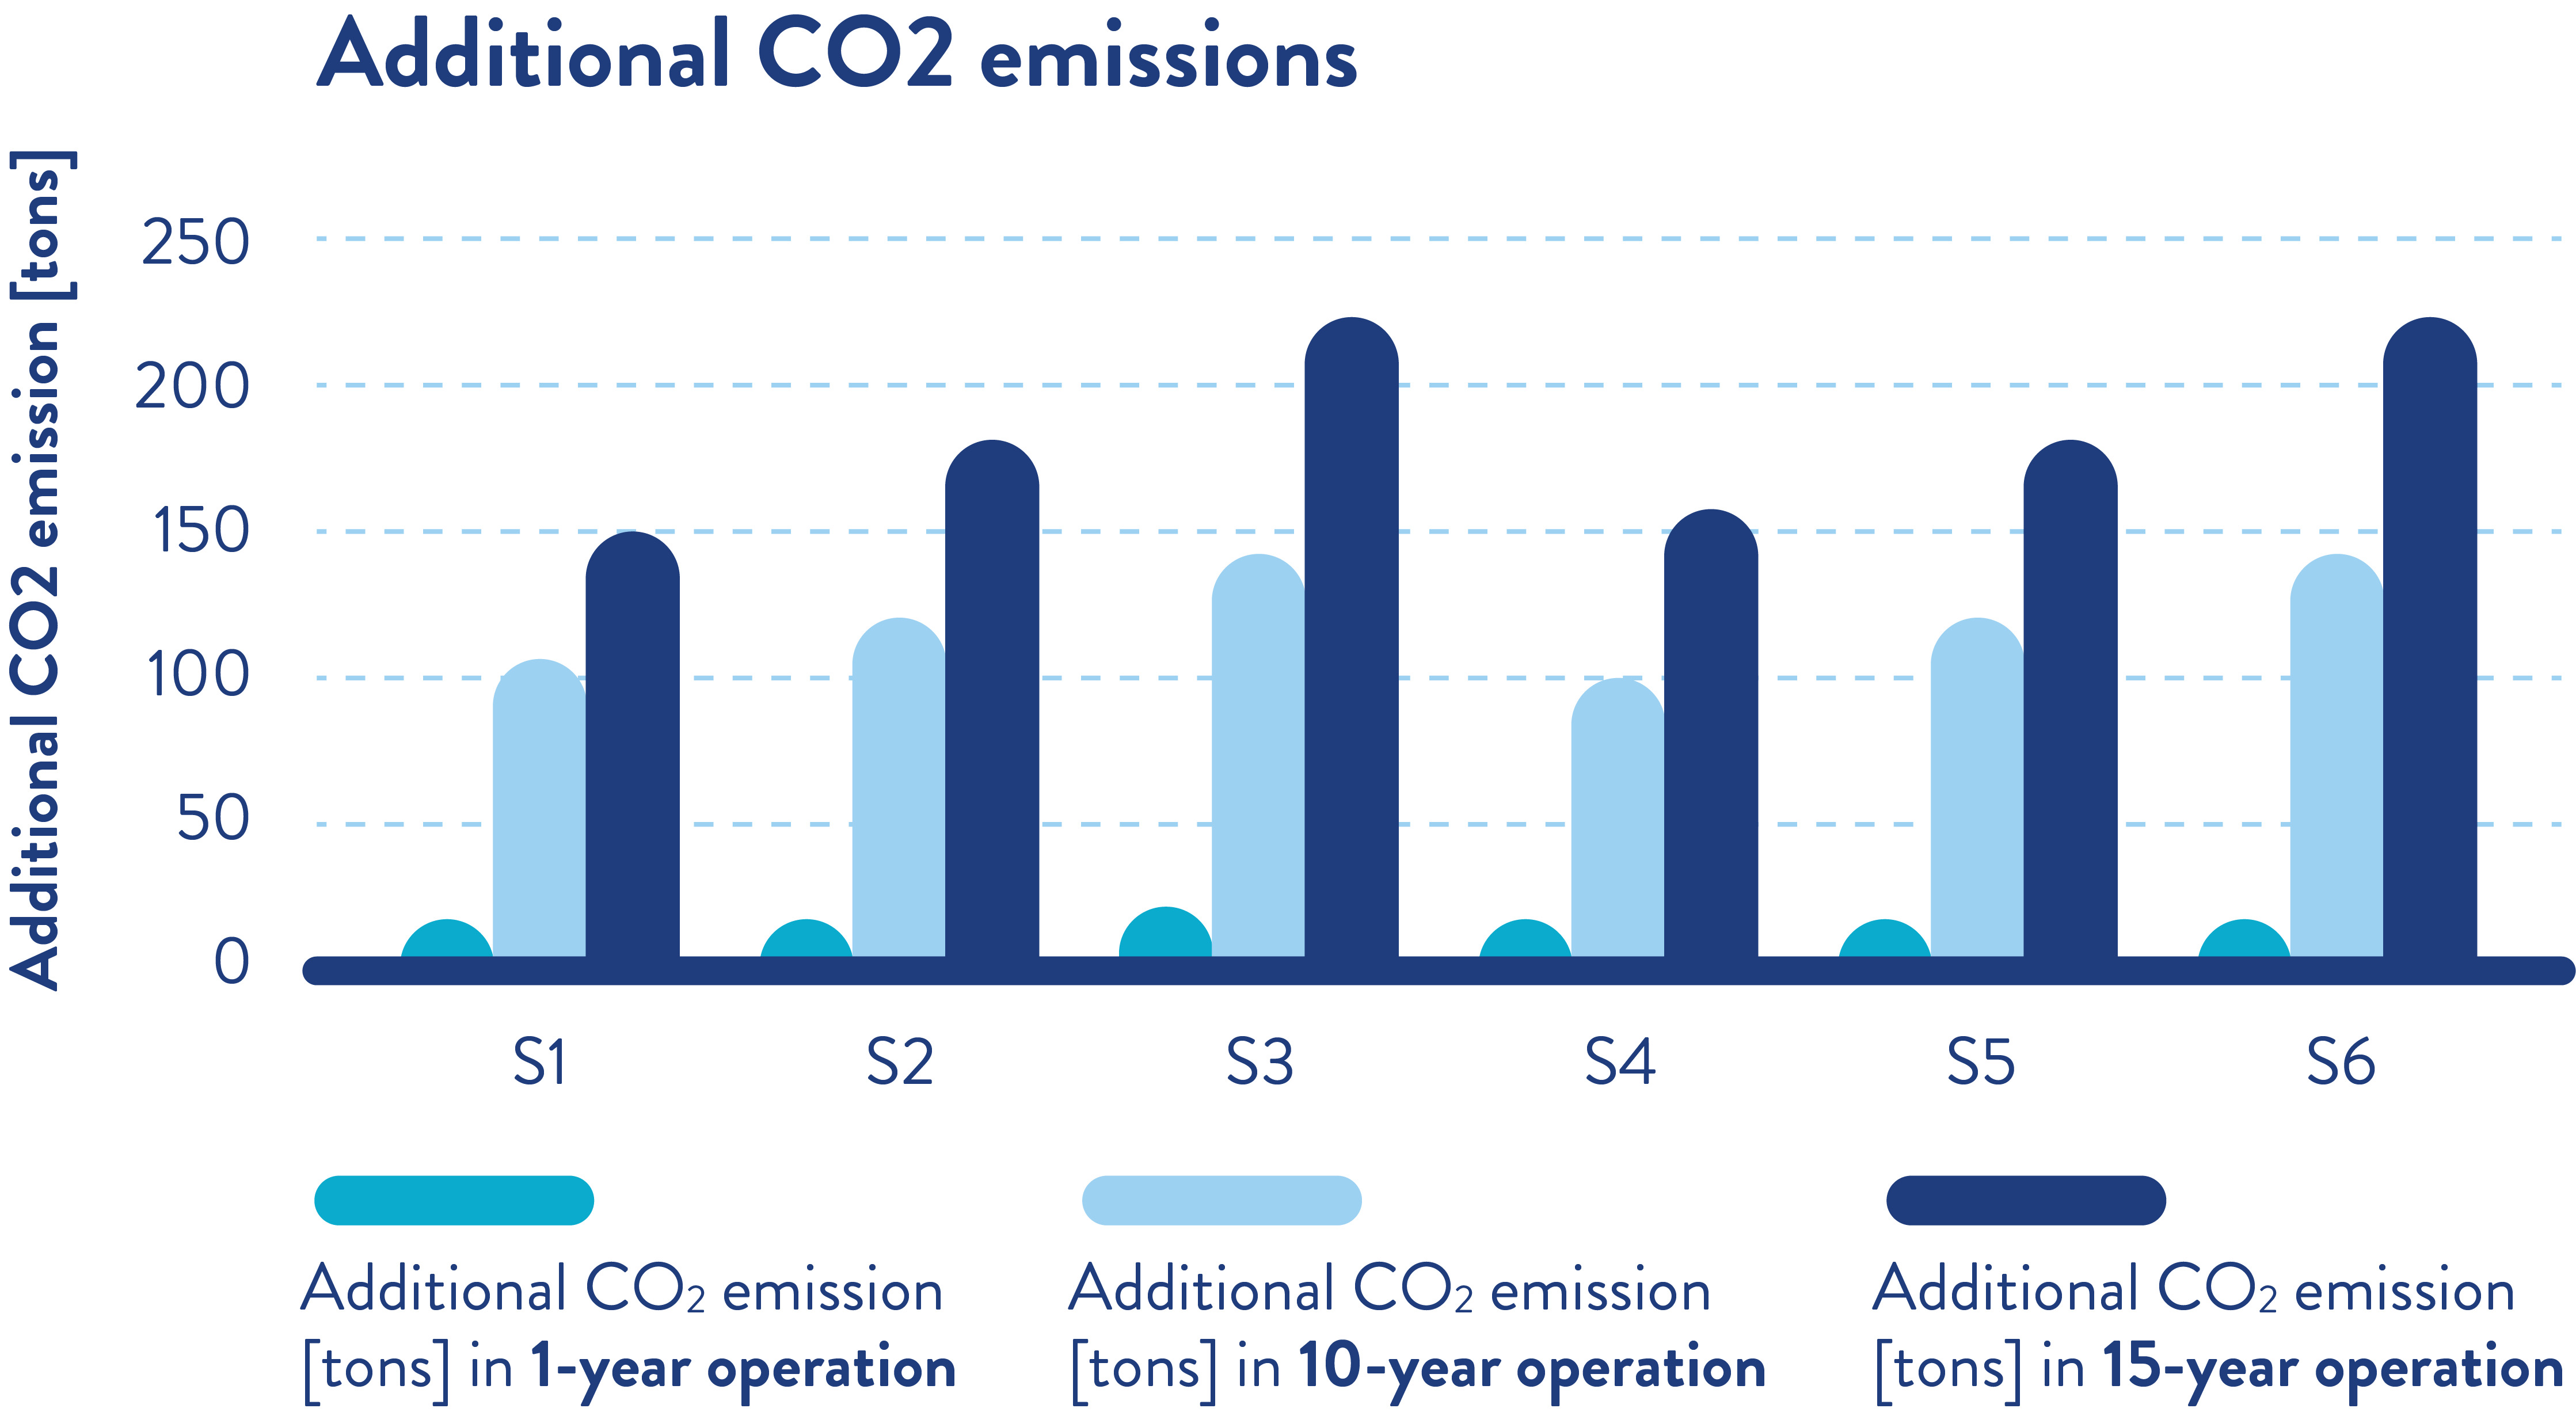
The results show that even a small underperformance can have a large impact over the lifecycle of a product.
Conclusion
Eurovent Certification was able to calculate the potential consequences of heat rejection equipment underperformance for a CO2 and a HFC supermarket application. Over a 15-year life cycle, both sets of underperforming heat ejection equipment may:
- Use at least 650000 kWh in additional energy
- Cost in excess of 117,000€ extra to run
- Produce over 219 tonnes of avoidable CO₂ emissions.
This is without considering the additional potential impact on system reliability and longevity, as components work harder to meet the required heat rejection under these simulated conditions. In short, the analysis indicated that the underperformance went further than the unit alone, potentially affecting the operation of the entire refrigeration system.
Discover more about the research and the impact of system underperformance by downloading the white paper: “Beyond the brochure: Exposing the reality of refrigeration product underperformance.”
View certified heat exchangers
View certification programme information
Refrigerant revolution revamps heat exchanger programme
When regional performance doesn’t add up
Join our LinkedIn community!